The QGen Model: First Principles in Hardware
Why buy expensive modeling software when you can build a cheapo test setup for better data?
Code on GitHub
Metal hydrides store hydrogen by absorbing it into a solid metal. To charge a vessel you push hydrogen in, to discharge you pull hydrogen out. Both reactions are thermal, and the amount absorbed or desorbed depends not just on pressure but on temperature. Absorption releases heat. Desorption requires heat. If the vessel cannot move heat fast enough, it throttles its own mass flow. It cannot absorb or release hydrogen any faster than it can manage its own temperature.
At Lumindt, this became the constraint as vessels got larger. We could watch them "choke" in real time. Push hydrogen in above a certain flow rate and pressure would spike because the vessel could not absorb fast enough. Pull hydrogen out too fast and flow would die. We watched vessels get too hot and stop accepting flow, and we watched vessels freeze over on the outside and stop releasing it. We knew heat was the bottleneck. We did not know how much, where it was going, or whether we needed active heat exchangers or whether the atmosphere alone would be enough. The standard answer is to buy simulation software. We built a test instead.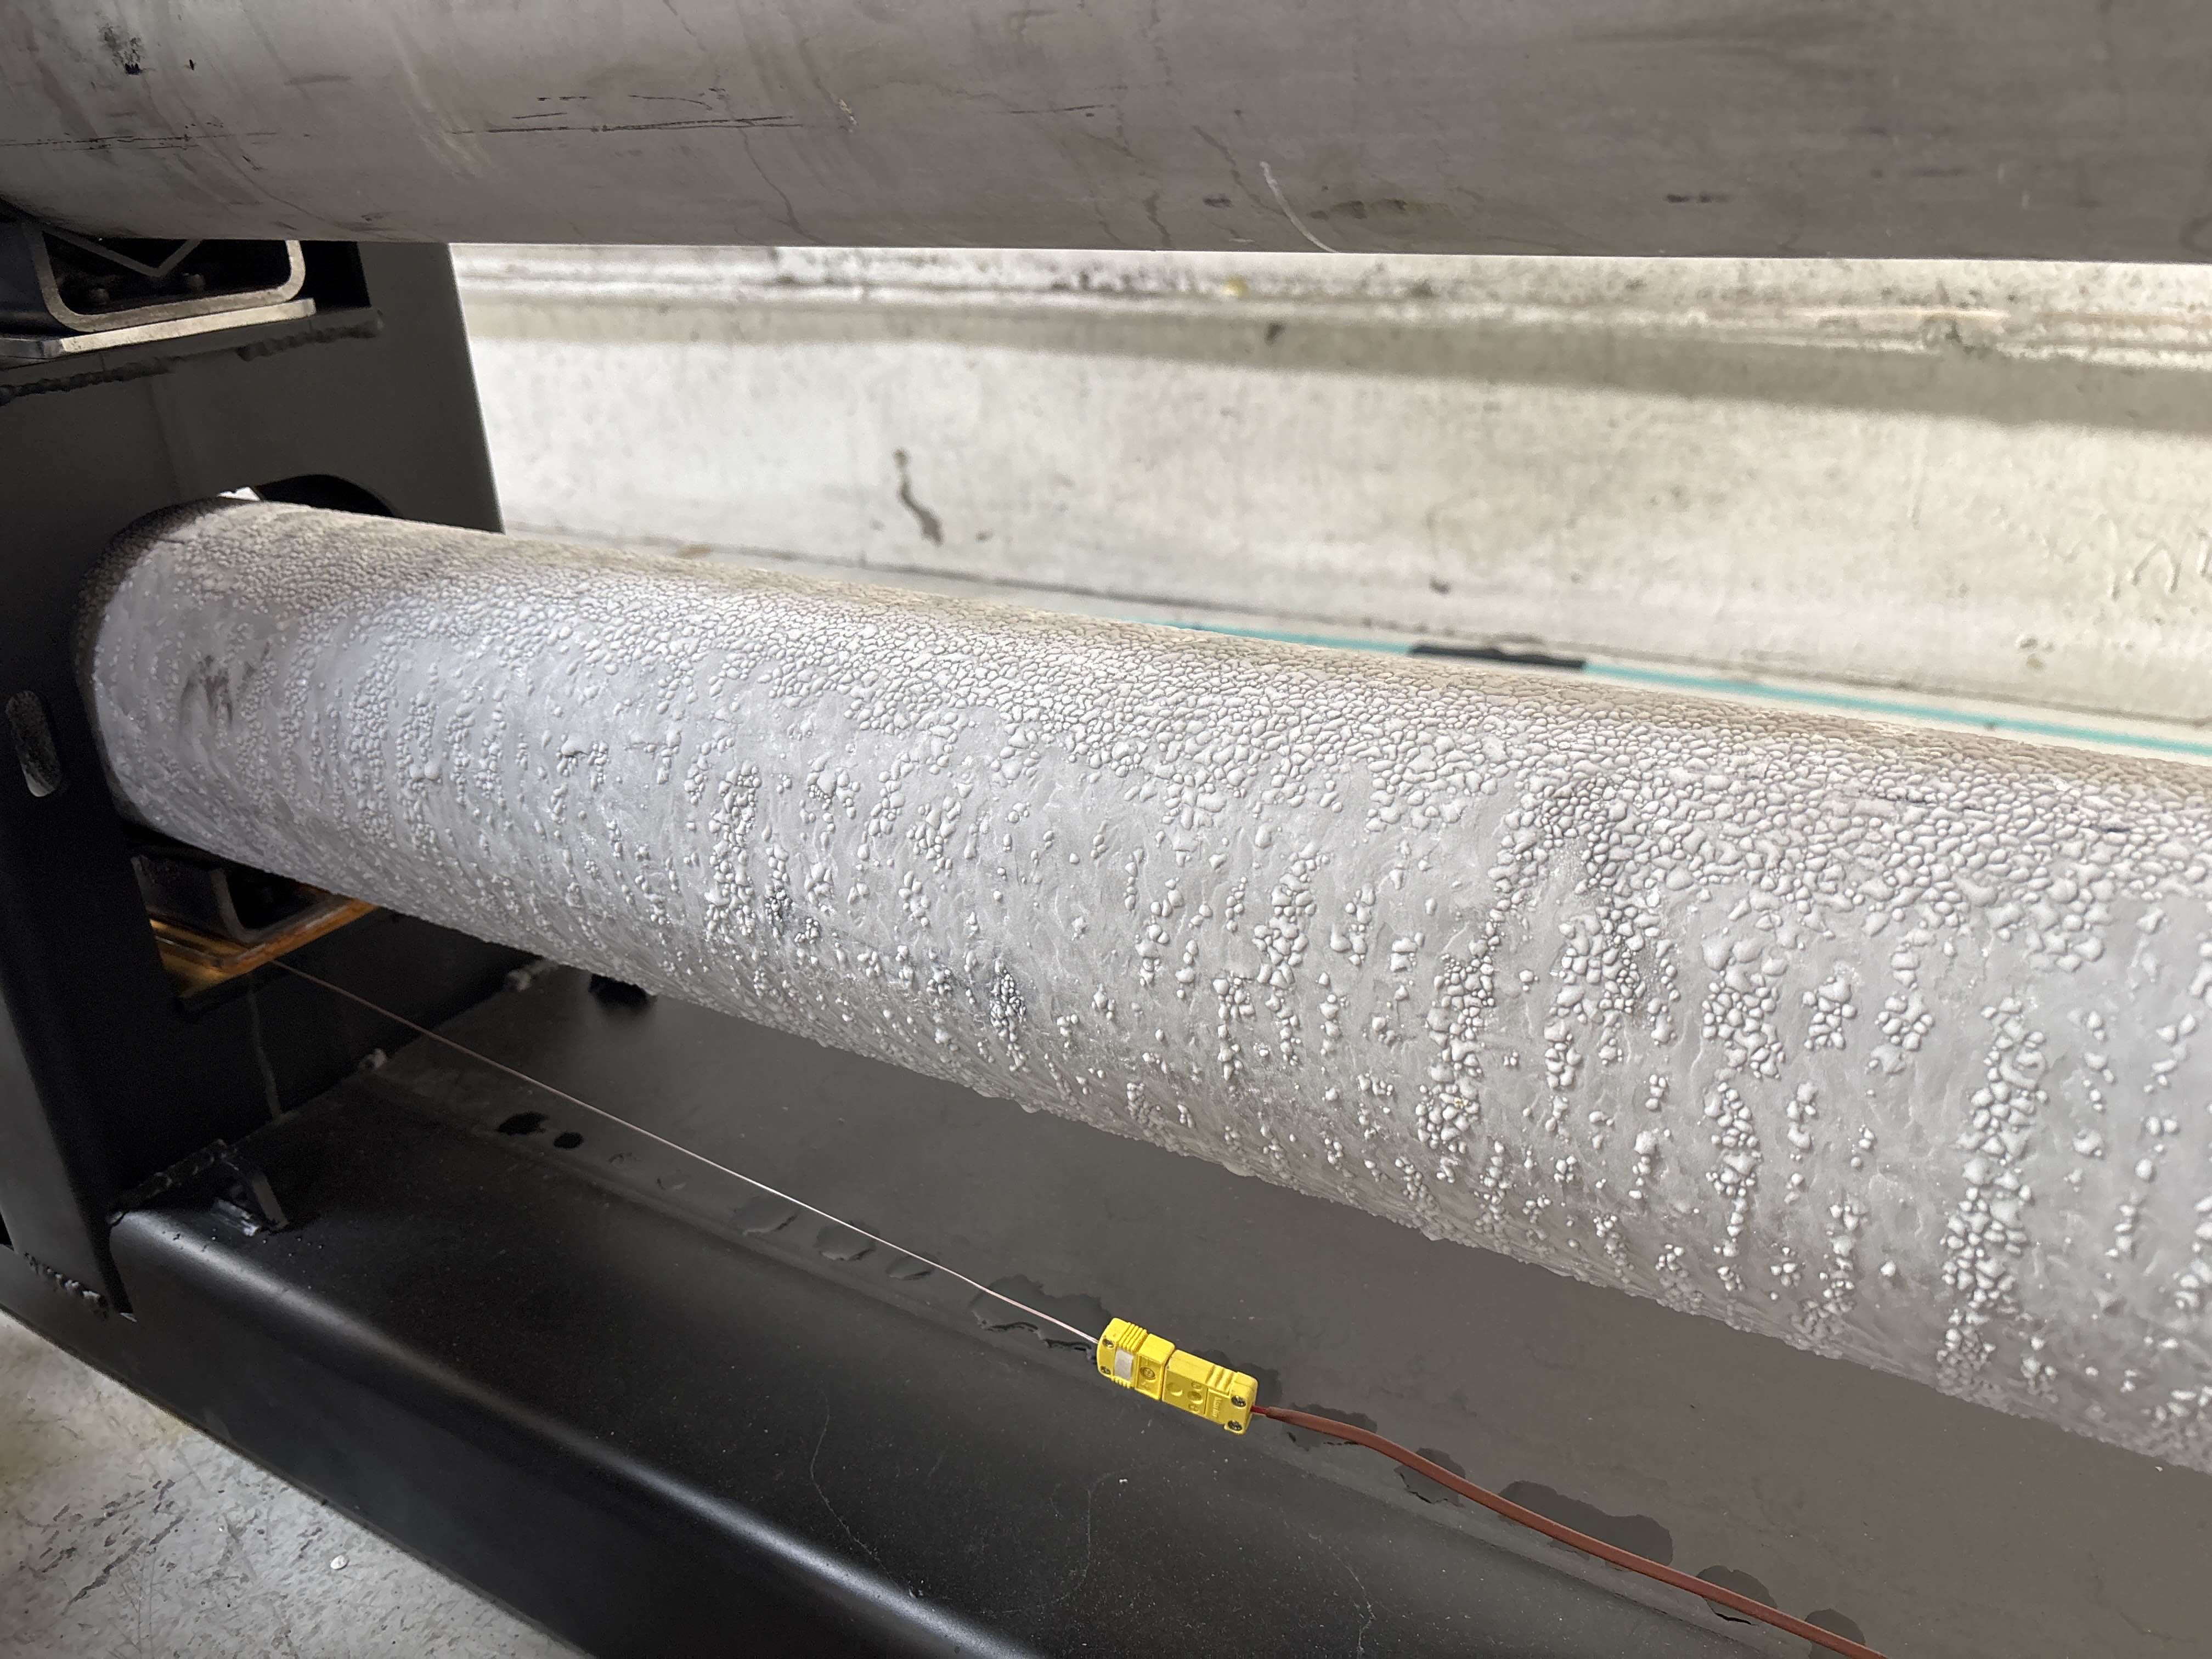
Metal hydride datasheets give you a PTC graph. Pressure Temperature Composition. It tells you the thermodynamic limits of the material, measured in a lab on milligrams of powder under tightly controlled temperature and pressure. Lumindt was working with thousands of kilograms in environments where neither could be tightly controlled. At that scale the PTC is a spec sheet, not a predictive tool even if you can get van't Hoff diagrams off it. The material is not just interacting with hydrogen anymore. It is interacting with vessel walls, geometry, and surface area ratios that have nothing to do with the lab setup it was characterized in. We used PTC data to define material limits and stopped expecting it to tell us what would actually happen inside a real vessel. What we needed was a way to measure actual heat generated per unit of hydrogen moved, tied to real geometry, so we could use it as a design input. That is what QGen is.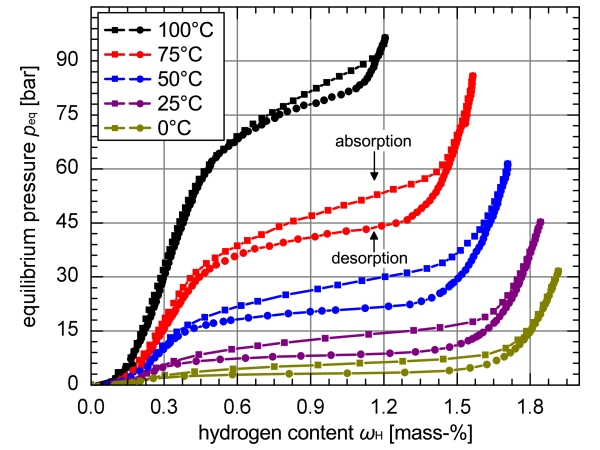
Here are some things we observed across vessels of different sizes and geometries:
- Hydrogen does not move through the bed uniformly. It finds preferential paths along the vessel length, so the temperature field is uneven axially and the bed cannot be treated as a single lump.
- The radial center sees the most extreme temperatures. Heat has to conduct outward to reach the wall, and the center is furthest from it.
- The vessel wall is doing most of the heat work, in both directions.
- Ideal gas law held well for gaseous H₂ at our operating conditions.
- State of charge mattered, especially at the boundaries.
The question we were after was: what is the actual relationship between heat and mass moving through a vessel, and can it be normalized to geometry so that length and diameter become real design inputs without running a new test for every configuration?
Starting from the first law of thermodynamics for a closed system with no work done, total heat generated equals the change in internal energy. That energy lives in three places: the hydrogen gas, the metal hydride bed, and the vessel wall. Each term is computed from sensor data at each timestep.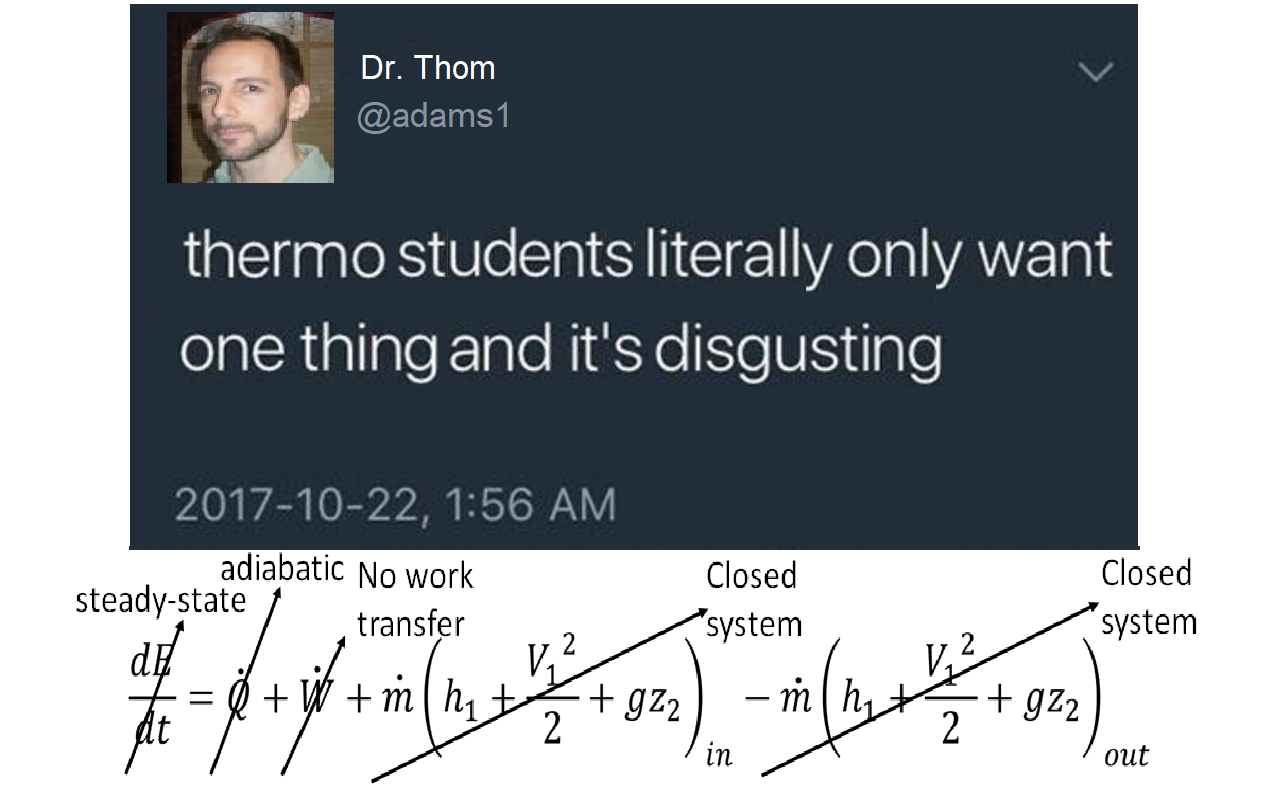
H₂ Gas
The hydrogen gas term is the most straightforward. Mass of H₂ at each timestep comes from the ideal gas law, which holds well at the pressures and temperatures we were operating at. Internal energy change follows from temperature change and the known specific heat. To compute it you need two measurements: pressure and gas temperature. That requirement feeds directly into sensor placement.
Metal Hydride
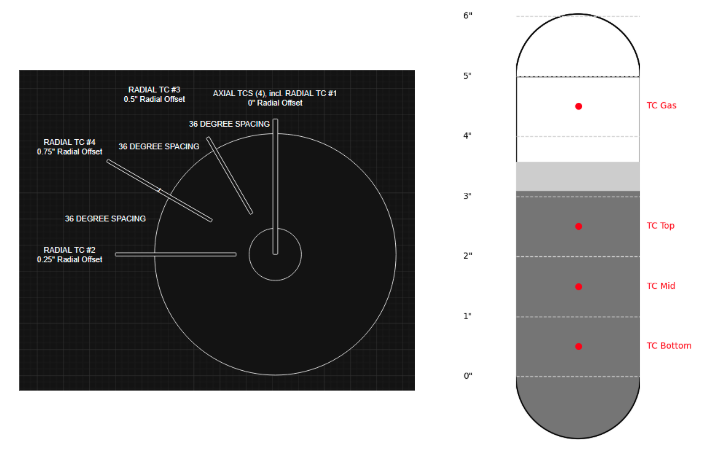
The metal hydride term is where it gets interesting. Temperature inside the vessel is not uniform, so you cannot use a single value. It is a function of position, both axially and radially. Thermocouples at three axial heights and four radial positions give a 2D grid, and polynomials are fit to each direction so the temperature field can be integrated over the full cylindrical volume. Quadratic fits the axial direction, where the profile curves. Linear fits the radial direction, where the gradient from center to wall is monotonic. Higher order fits in either direction would overfit the sparse data without adding accuracy. The math tells you what you need: enough sensors in each direction to find a proper relationship, no more.
Vessel Wall
The vessel wall term uses the same radial fit, extrapolated out to the inner wall radius at the mid-height axial position. This is a simplification of the full double integral over wall thickness and axial height, which would require wall temperature measurements at multiple axial positions. With one radial plane of TCs, extrapolating to the inner wall at Z1 and applying a single dT is the tractable approximation. The wall only heats where it contacts metal hydride. The hydride fills roughly 70% of the internal vessel volume, so wall mass is scaled by 0.7.
The reason this process matters is not just that it produces equations. Working through the first law term by term tells you exactly what to measure and where to put sensors before you have built anything. The test design came out of the math, not the other way around.
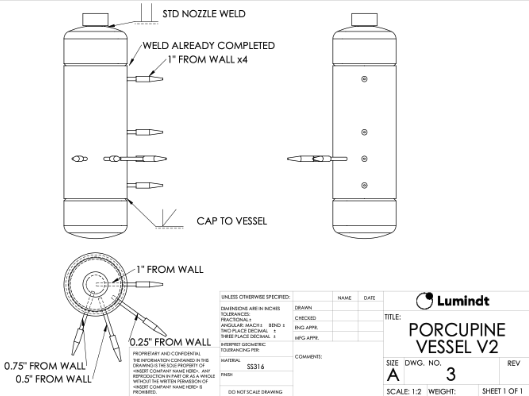
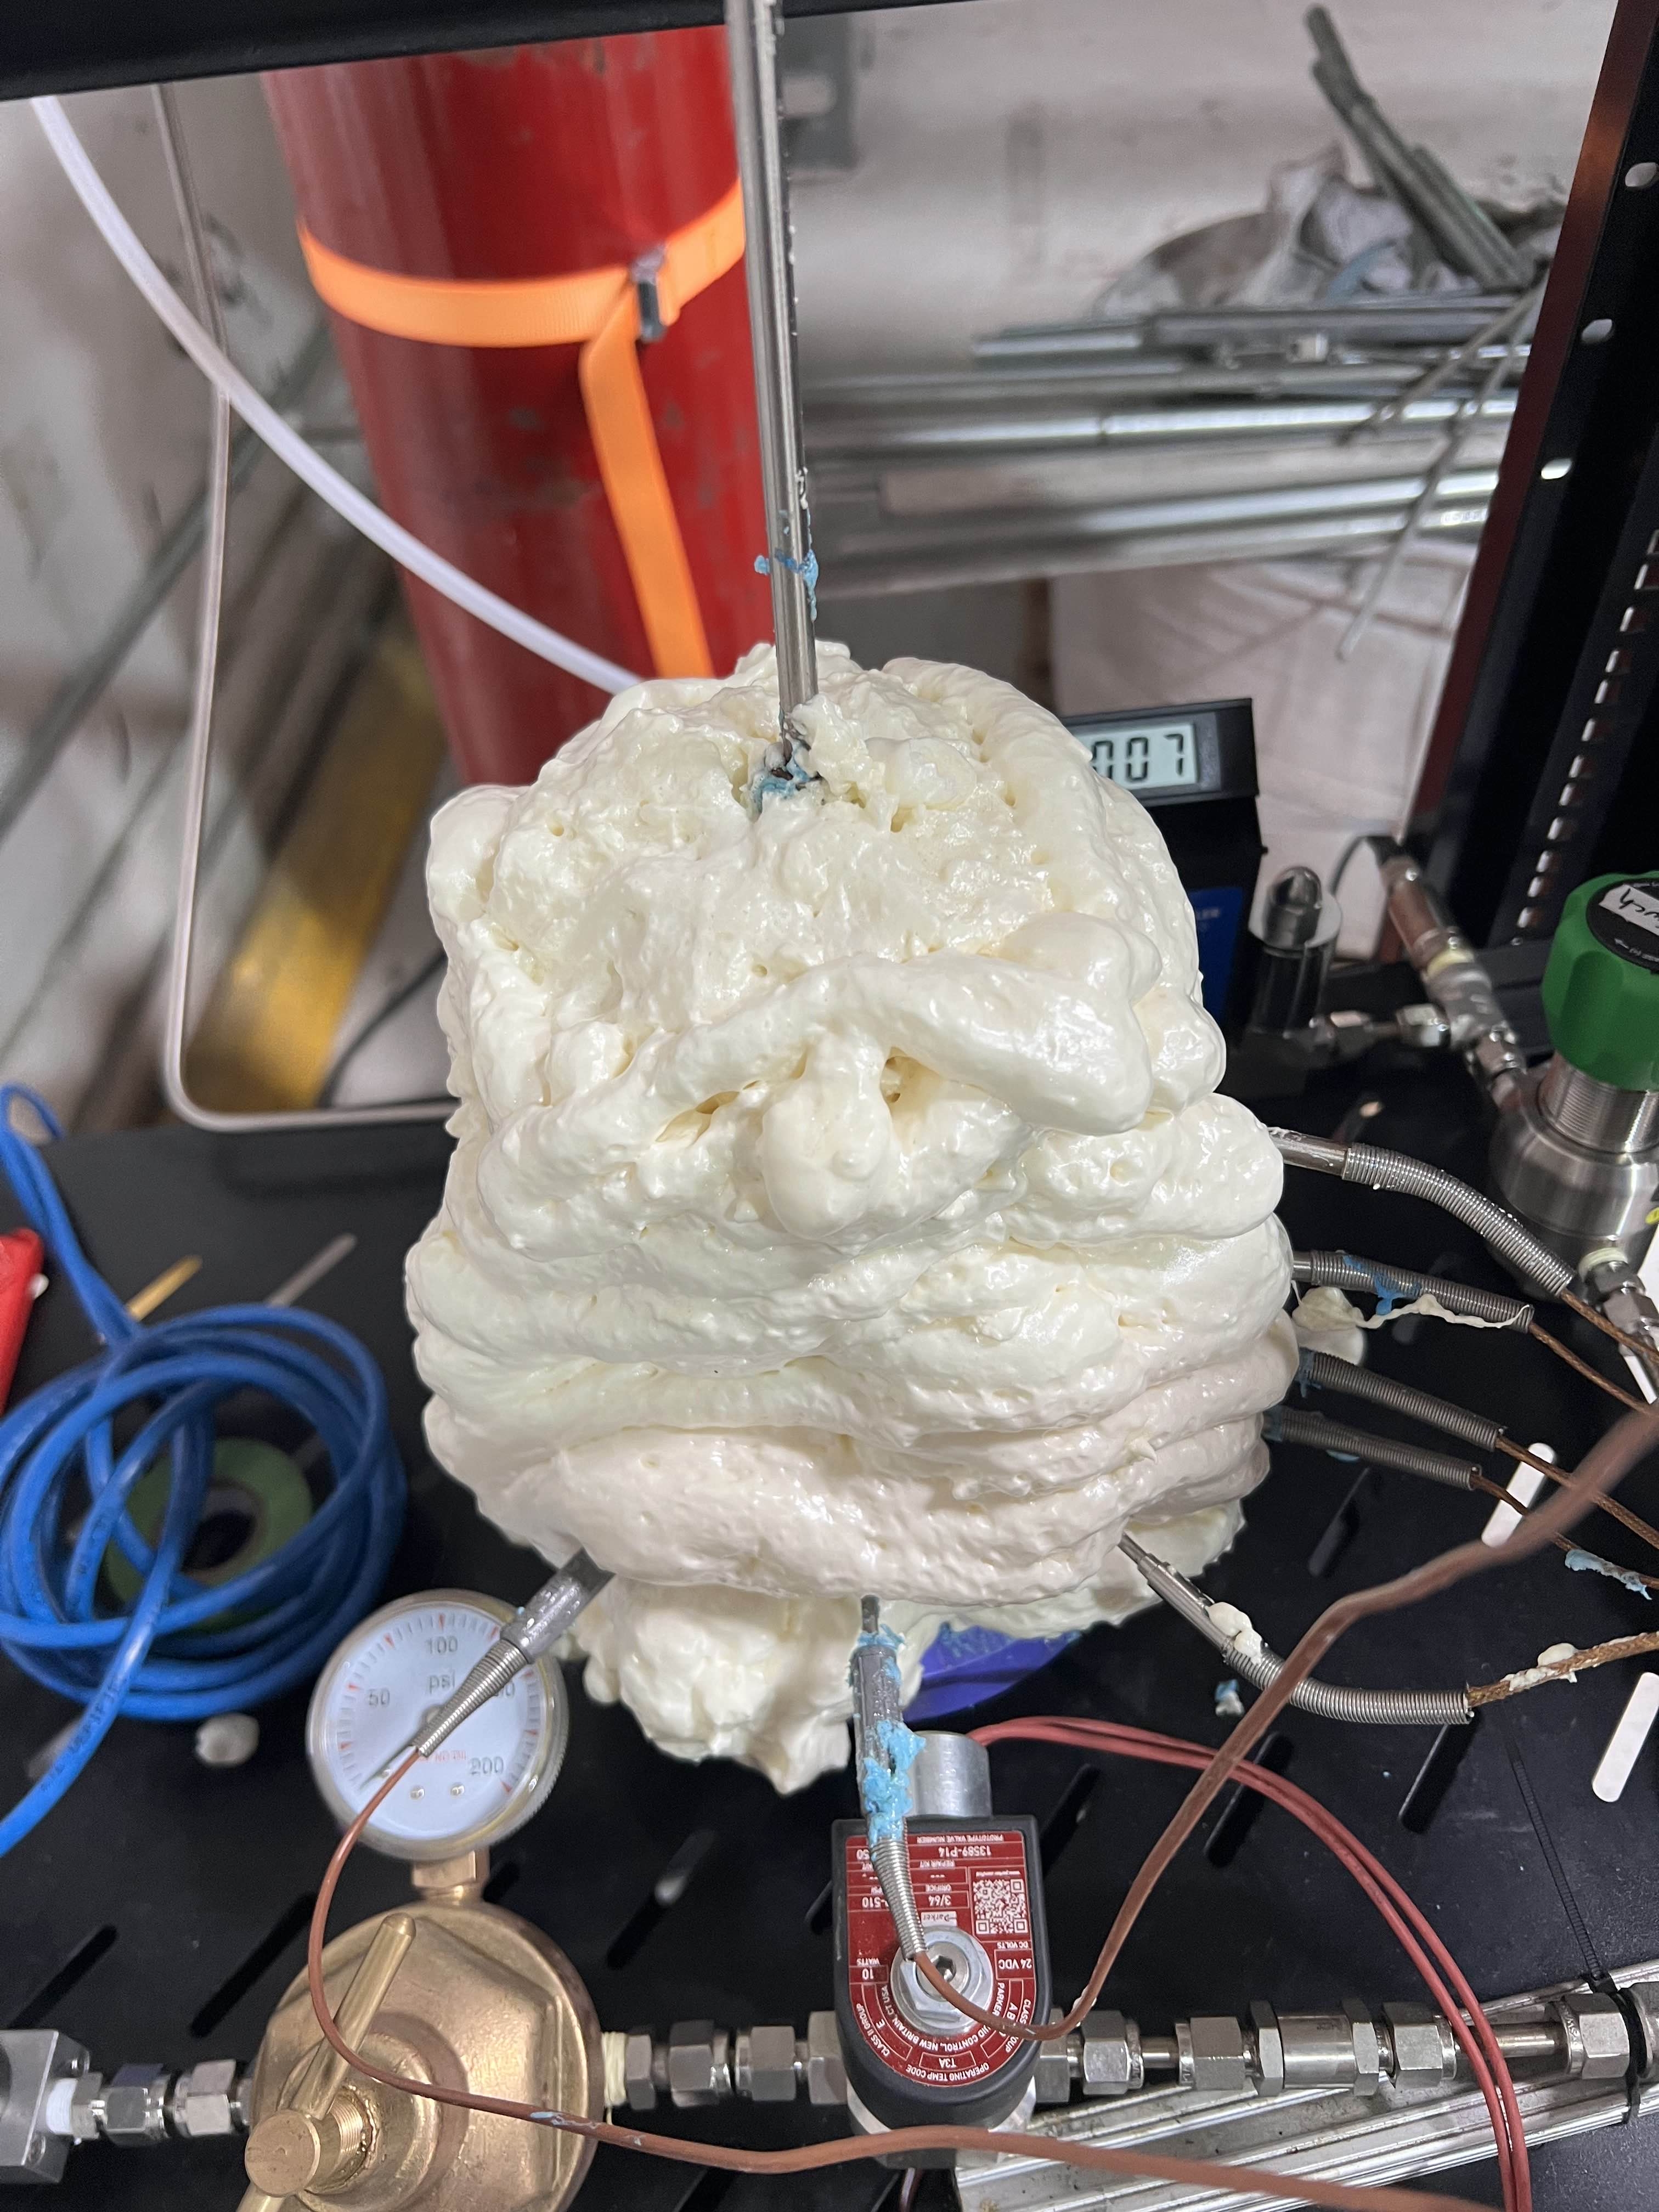
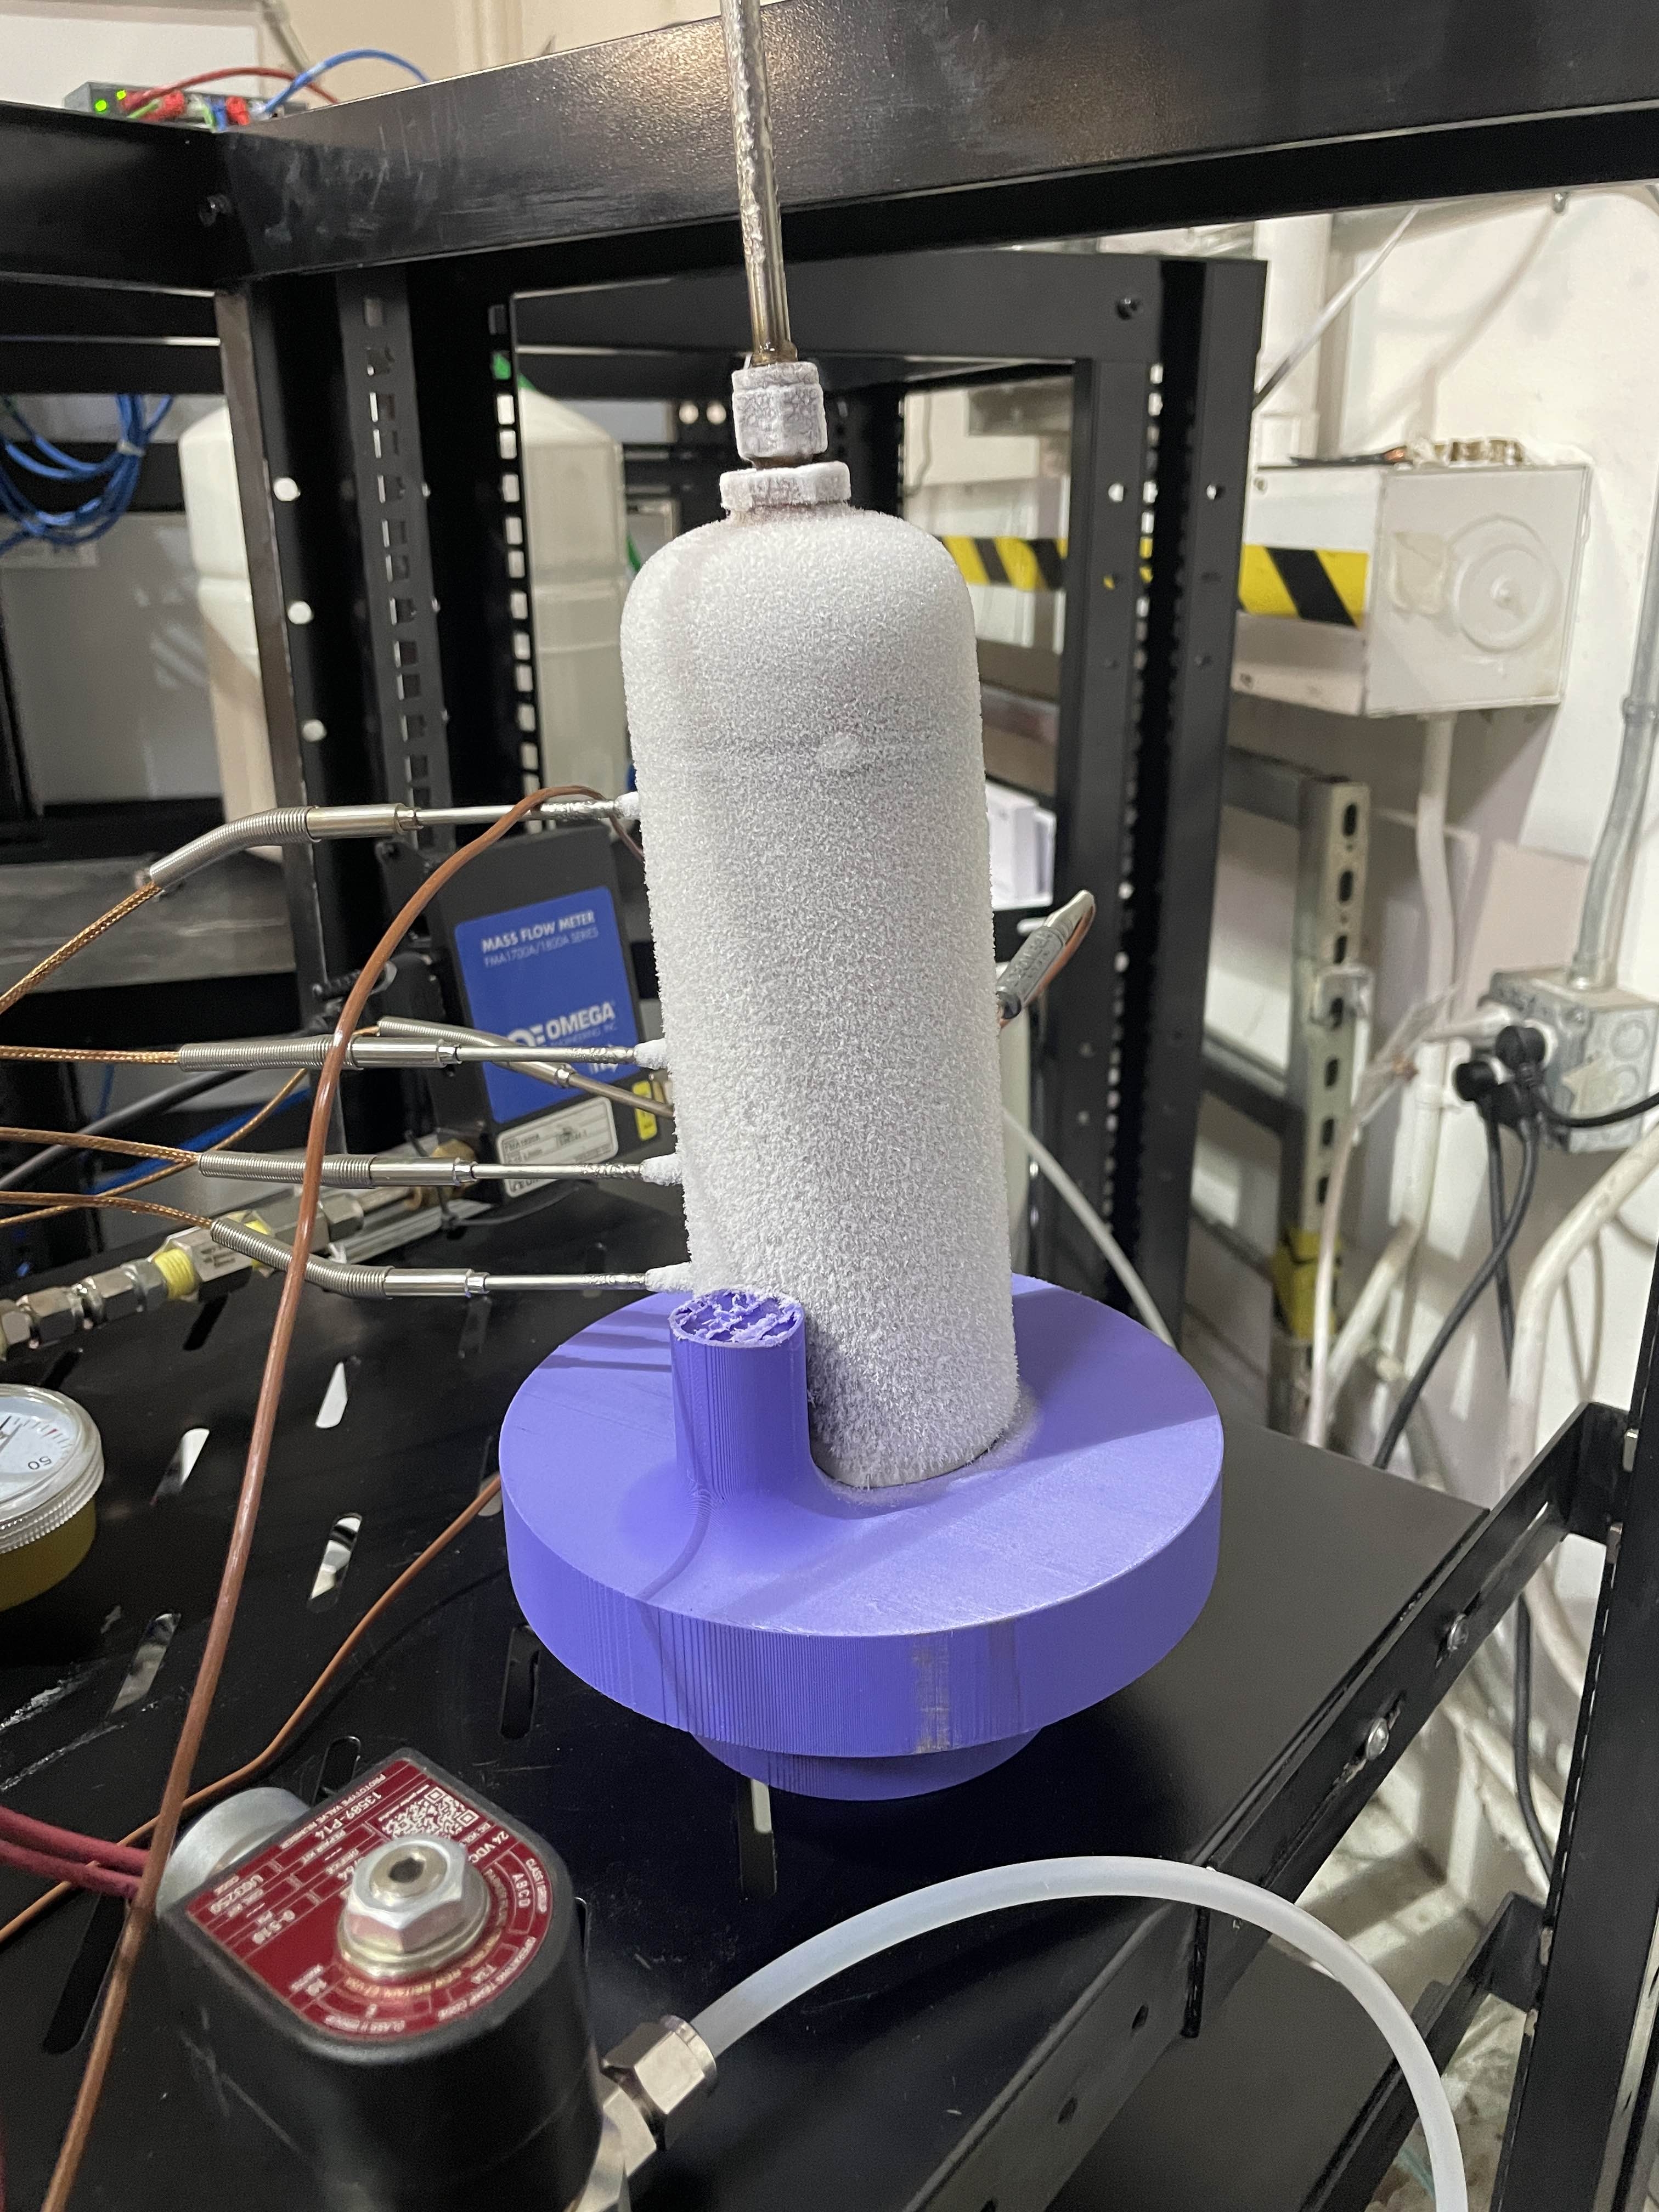
We built a small instrumented SS316 vessel, filled it with hydride, and welded eight thermocouples into it. We called it the Porcupine.
Placement came directly out of the math. We had already seen two things in larger vessels that told us where to look. First, hydrogen moves preferentially along the length of the bed, so vessels heat unevenly top to bottom depending on where the reaction is happening. Three TCs along the axial centerline capture that gradient across the full bed. Second, as the hydride absorbs hydrogen it becomes increasingly ceramic in character, meaning thermal conductivity drops and the center of the bed becomes thermally isolated from the wall. The vessel wall is the only real heat exchanger, so understanding the radial gradient was critical. Four TCs at mid-height from center to wall map it directly. Together, the axial and radial arrays let us capture the full thermal behavior of the hydride bed and how heat conducts through to the vessel wall. A gas headspace TC gives hydrogen gas temperature for the model. The outer surface TC gives the wall boundary condition needed to compute the vessel wall energy term.
TCs were welded, not inserted, because that is how you instrument a pressurized hydrogen vessel. The vessel ran vertically because hydrogen is buoyant and a horizontal orientation would corrupt the axial measurements.
Before each run the vessel was wrapped in kiln insulation. The model assumes no work done on the system, so heat exchange with the atmosphere has to be slow relative to the reaction. The insulation is not a perfect seal. It does not need to be. It just needs to buy enough time to get a clean measurement window.
Four desorb cycles were run at 100%, 75%, 50%, and 25% SOC. We ran desorb because that is what we had available, but the same approach works for absorption. We had already seen that thermal behavior changes character across the discharge curve, so assuming linearity would have been wrong. Between runs the kiln was used to move the vessel to the next state of charge. Each measurement desorb released a small fixed quantity of hydrogen at a controlled flow rate, small enough that state of charge stays approximately constant within a single run.
A Raspberry Pi logged everything: pressure, all eight TC temperatures, flow rate, and cumulative mass through a flow controller.
The heatmap shows the reconstructed temperature field inside the vessel during desorb 3. It is mirrored across the centerline because the vessel is cylindrical and radially symmetric. We only instrumented one side, so mirroring is a visualization choice that makes the field easier to read. The white dots are the actual thermocouple positions. Everything else is interpolated from the polynomial fits.
What it shows is the axial gradient we had been seeing qualitatively in larger vessels, now captured with actual numbers. The bottom of the bed runs cold because that is where hydrogen is leaving. Desorption is endothermic and the reaction is happening preferentially at the bottom, drawing heat out of the material there. The top is warmer because it has not reacted yet. As the desorb progresses you can watch that cold front move up through the bed as hydrogen works its way out.
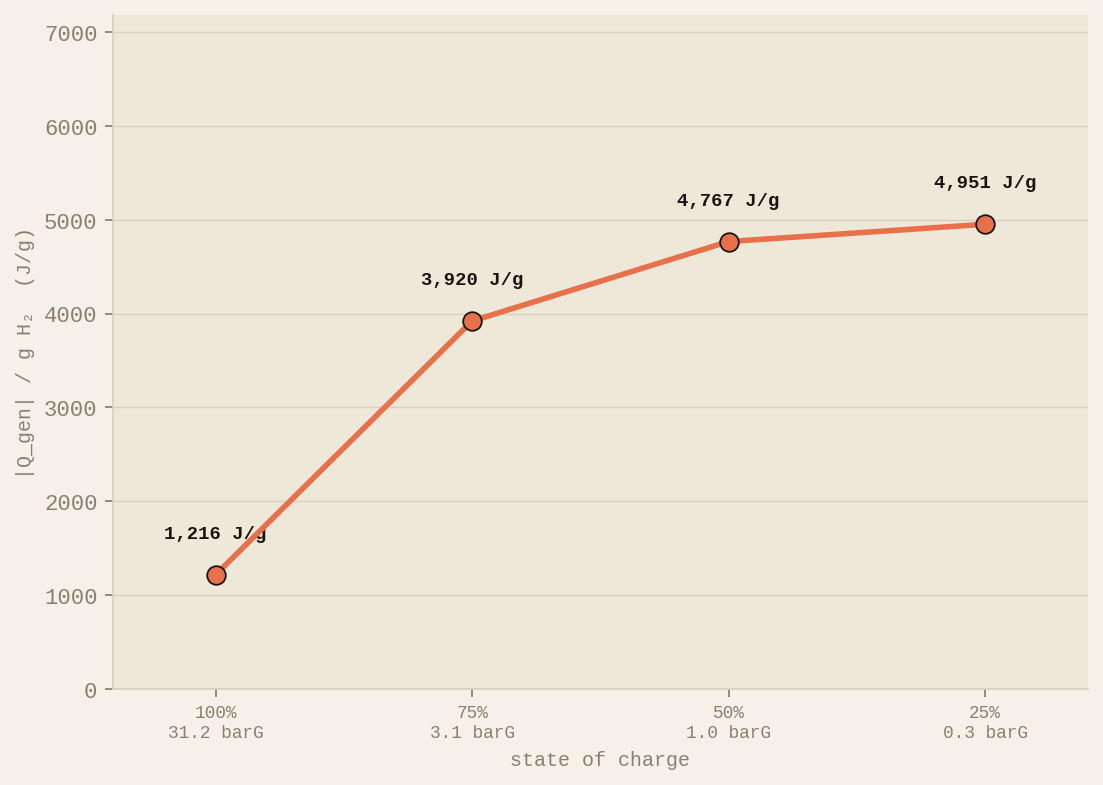
The plot below shows heat extracted per gram of hydrogen moved across the four states of charge. The trend is physically motivated: at 100% SOC the vessel is at 31 barG, the pressure gradient is large, and hydrogen moves easily, 1,216 J per gram. As the bed depletes and pressure drops toward and below the plateau, the driving force shrinks. The reaction has to work harder per gram moved. By 25% SOC that number has risen to 4,951 J per gram. This is not a linear relationship, and it is not something the PTC curve alone would have told you. The PTC gives thermodynamic limits at controlled temperature, not the actual heat cost at real operating conditions and geometry.
Desorb 2 at 75% SOC sits lower than the trend would suggest. The cause is not confirmed. It could reflect a real step change in material behavior at that SOC, or it could be a sensor artifact on that run.
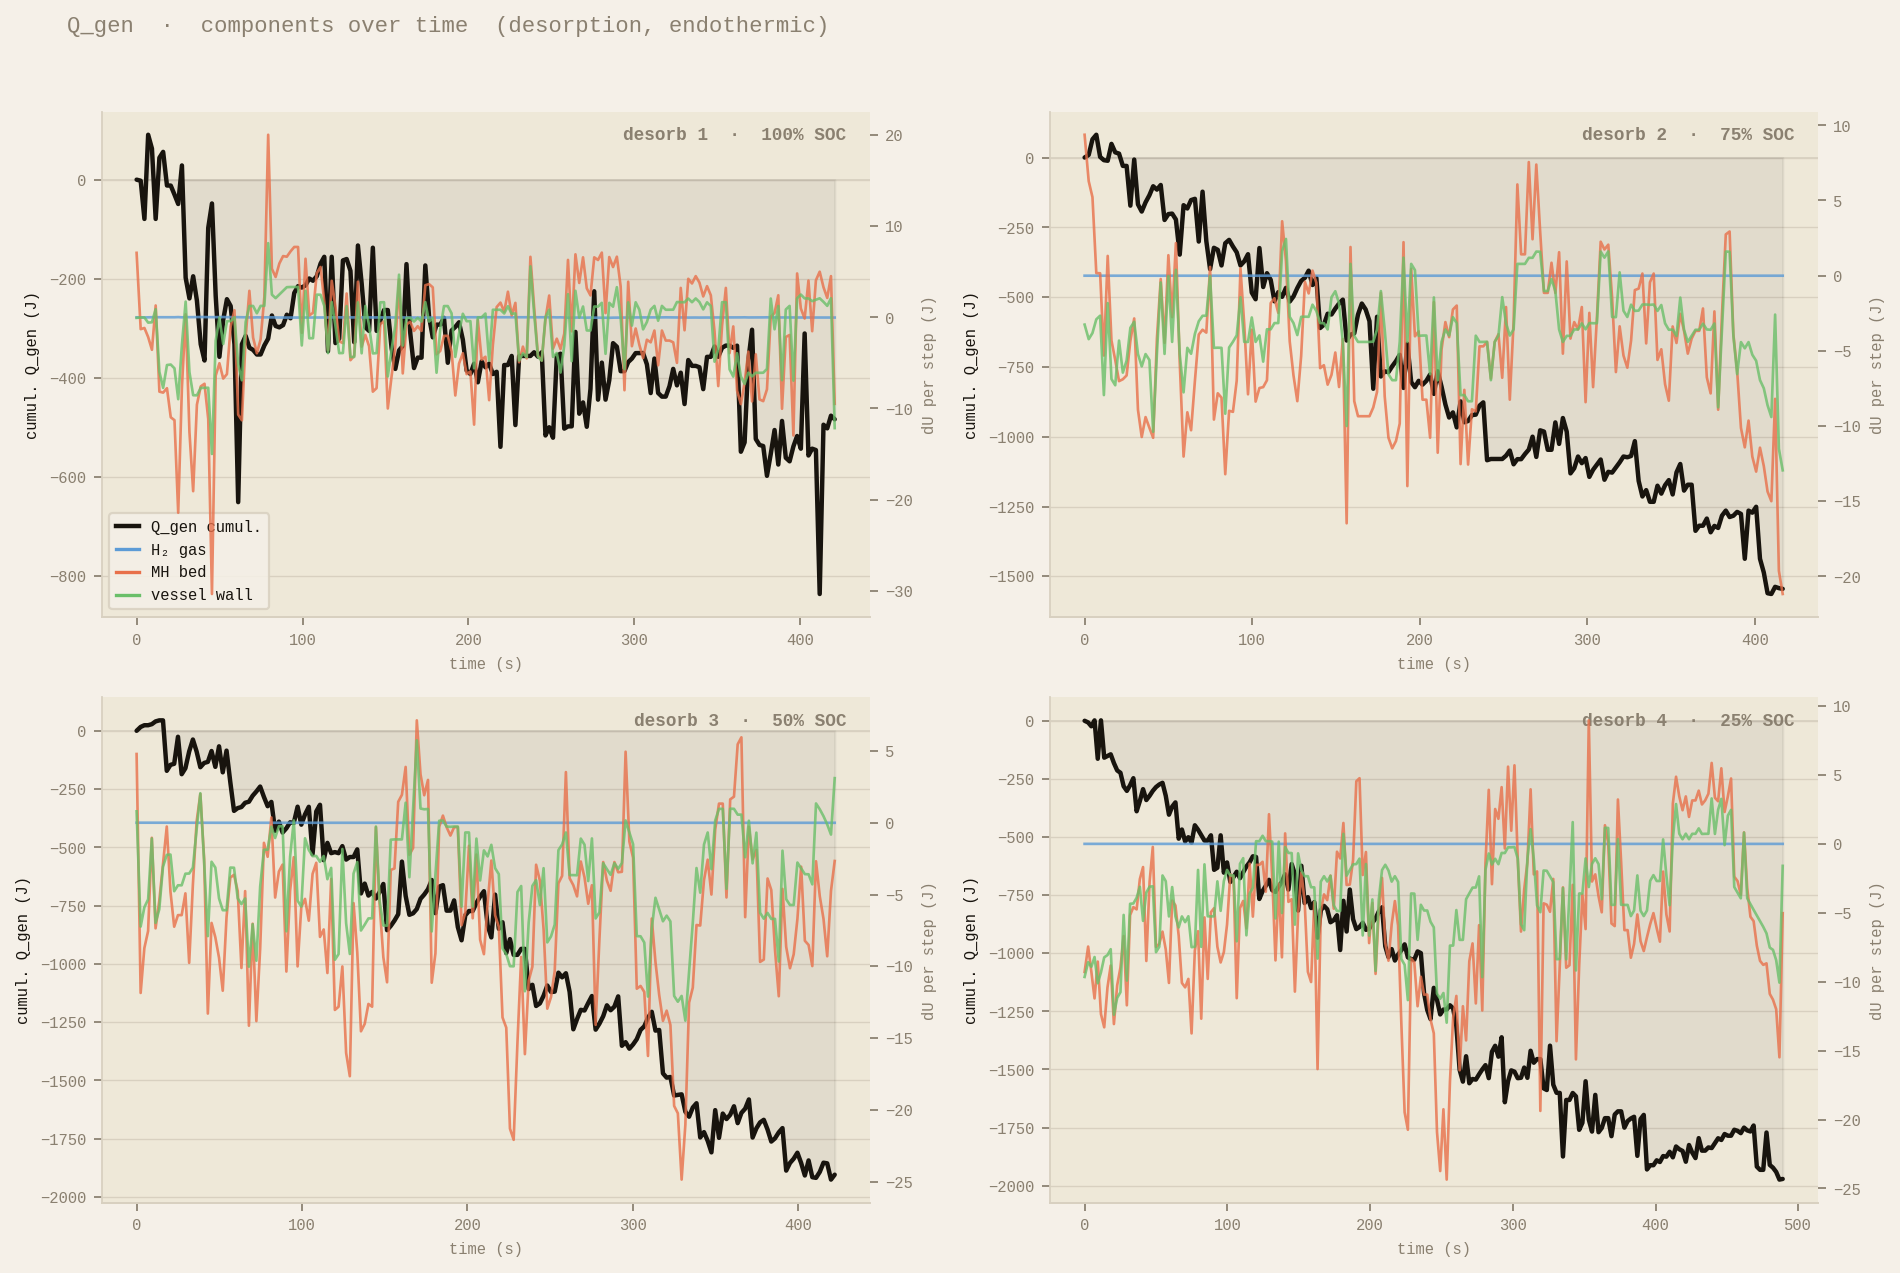
The component breakdown shows where that heat is coming from at each timestep. The MH bed term dominates, it is the primary thermal mass and where the reaction is happening. The vessel wall term is negative throughout, meaning the wall is slowly losing heat to the atmosphere through the insulation over the course of each 420-second run. It is not negligible. Treating the bed in isolation would have underestimated the total heat extracted in every desorb.
The honest answer is that we could have. Commercial simulation tools for metal hydrides exist. They are expensive, slow to parameterize, and require material properties at scale that nobody has measured. You would spend months setting one up and still be making assumptions about the inputs. This test took a week to run. Total instrumentation cost was under $500. The model runs in minutes. More importantly, it is grounded in measured data from a real vessel with real geometry, not assumed properties from a datasheet. Swap in different vessel dimensions and you get a new QGen estimate without rebuilding anything. That is the point of doing it from first principles rather than buying a black box.
What is shown here is a slice of a larger body of work. The full dataset covers more materials, more vessel configurations, and more test conditions.
Two things I would improve in the model itself. First, the work term. The derivation assumes W = 0 but the hydride expands when it absorbs hydrogen. Adding a P delta V term from that expansion would make the energy balance more rigorous, especially at high states of charge where the expansion is most significant. Second, absorption. We ran desorption because that is what we had available, and it was enough to get a heat exchanger specification off the ground. But absorption is a different thermal curve and you need both to fully close the design. The setup supports it. It just needs the data.